ABSTRACT (SUBCONTRACT FOR MONITORING)
The major objective of GENI (Global Environment for Network Innovation), a virtual laboratory for exploring future internets at scale, is to create major new opportunities to understand, innovate and transform global networks and their interactions with society. Dynamic and adaptive, GENI opens up new areas of research at the frontiers of network science and engineering, and increases the opportunity for significant socio-economic impact.
GENI will employ a flexible and adaptable framework that incorporates spiral development, i.e., iterative prototyping, and federation, i.e., connecting heterogeneous networks, substrates and technologies. It is expected that each turn of the spiral will take advantage of what currently exists, what has been learned from the previous spiral, what can fruitfully be federated and what might be achieved through new development and prototyping activities. Spiral 1 will allow academic-industry partners to create end-to-end GENI prototypes with a strong emphasis on the design and implementation of multiple GENI control frameworks. The ultimate goal is to design end-to-end prototypes of a virtual laboratory with a suite of infrastructure that will support future experiments and research challenges articulated by the Network Science and Engineering (NetSE) research community.
Intellectual Merit: This award gives funding to BBN Technologies to provide management and oversight of all GENI-related activities. GENI will 1) support at-scale experimentation on shared, heterogeneous, highly-instrumented infrastructure, 2) enable deep programmability throughout the network, promoting innovations in network science, technologies, services and applications, and 3) provide collaborative and exploratory environments for academia, industry, and the public to catalyze groundbreaking discoveries and innovation.
Broader Impact: Encouraging community engagement is critical to success. A GENI outreach plan will be developed and implemented. Each year, three GENI Engineering Conferences will be held. Open application for travel grants will ensure that researchers and students at underserved academic institutions and regions of the country will be able to participate. Potential partners in industry and international funding agencies will also be encouraged to attend. Students and young faculty will be hired as interns at BBN. As needed, interdisciplinary workshops will be convened that bring together researchers that don?t normally communicate, but from which GENI and the research community can benefit.
There is no pre-ordained outcome for these activities; the resultant GENI infrastructure suite could be an enahanced Internet, enhanced testbeds, federations of enhanced testbeds, something brand new (from small to large), federation of all of the above and/or federation with related international efforts. The goal is to promote innovation, entrepreneurship, and economic growth.
NSF – Subcontract 1939C C.O. Raytheon BBN Technologies
GENI Monitoring Alerts
The GENI monitoring alerts system is based on the detection of events based on metric data that polled from remote systems. Raw data is published to a queueing system, which allows multiple complex event queries to operate on the same data stream in parallel. Output of complex queries can generate Nagios alerts, log results to a database, or both.
Poll to raw metric stream
As part of the polling process raw data is both recorded in a database and pushed to a queue. The queue serves as a fanout interface for a one-to-many raw metric subscription service.
 *
*
In the previous figure P represents our polling agent, which publishes data to a queue exchange represented by X. Clients, designated as C1 and C2, subscribe to exchanges by binding their own queues to exchanges. In the example, data published by P is replicated by X to client queues amq.gen-RQ6.. for client C1 and amq.gen-As8… for client C2.
Stream query of metric stream
The publish/subscribe queuing system allows streams of raw metric data to be replicated between many processes in parallel. This allows us to instantiate one or more complex event processing engines CEPE per replicated data stream and one or more queries inside of each CEPE. We make use of the Esper http://www.espertech.com/ CEPE.
Esper complex event processing engine
Esper allows us to analyze large volumes of incoming messages or events, regardless of whether incoming messages are historical or real-time in nature. Esper filters and analyzes events in various ways, and respond to conditions of interest. An example of the Esper CEPE architecture is shown in the figure below.
 **
**
Simply, CEPE queries are pattern-based (matching) subscriptions describing a possible future event. If the described event occurs, a described output is emitted from the CEPE.
Esper query format
In a typical database we query existing data based on some declarative language. We can think of and Esper query like an upside down SQL, where if events occur in the future, results will be emitted. The Using the ESPER query language, EPL (similar to SQL) complex events can are described. The EPL language reference and examples can be found here: [ http://esper.sourceforge.net/esper-0.7.5/doc/reference/en/html/EQL.html]
Consider the following EPL query:
select count(*) from MyEvent(somefield = 10).win:time(3 min) having count(*) >= 5
- There exist a stream of events named MyEvent.
- In the MyEvent stream there are events that contain a field named: somefield
- In a 3 minute window, if somefield = 10 five or more times, emit data.
Just as traditional relational databases, and their related SQL queries, use specific data type operations based on column data types, data streams processed by Esper are defined by strongly typed object classes. In the previous EPL query the somefield field would have to defined as a numeric time in order for mathematical comparison to work.
GENI monitoring stream data format
For GENI Monitoring alerts, we use the LogTick class shown in the code block below:
public static class LogTick
{
String source;
String urn;
String metric;
long ts;
double value;
public LogTick(String source, String urn, String metric, long ts, double value)
{
this.source = source;
this.urn = urn;
this.metric = metric;
this.ts = ts;
this.value = value;
}
public String getSource() {return source;}
public String getUrn() {return urn;}
public String getMetric() {return metric;}
public long getTs() {return ts;}
public double getValue() {return value;}
@Override
public String toString()
{
return “source: ” + source + ” urn:” + urn + ” metric:” + metric + ” timestamp:” + ts + ” value:” + value;
}
}
Example GENI monitoring stream queries
Note how the following data types are used in the example queries.
…
String source;
String urn;
String metric;
long ts;
double value;
…
There exist two types of queries:
Alert Queries: are used to send remote alerts to remote Nagios https://www.nagios.org/documentation hosts. These queries require 5 explicitly defined values to be emitted by the query including, “nagiosserver”, “hostname”, “servicename”, alertlevel, and “alertmessage”. The function used to generate the payload sent to your Nagios server is shown below:
public void alert(String hostName, String serviceName, String alertLevel, String alertMessage)
{
MessagePayload payload = new MessagePayloadBuilder()
.withHostname(hostName)
.withLevel(Level.valueOf(alertLevel))
//.withServiceName(“Service Name”)
.withServiceName(serviceName)
.withMessage(alertMessage)
.create();
…
The following queries are examples of Alert Queries:
- If metric gpo:is_available is set to 1 emit OK select ‘nagiosserver.somedomain.com’ AS nagiosserver, urn AS hostname, metric AS servicename, ‘OK’ AS alertlevel, ‘Alert comes from rack ‘ || ‘ source:’ || source AS alertmessage from LogTick(metric=’gpo:is_available’) where value = 1
- If metric gpo:is_available is set to 1 emit CRITICAL select ‘nagiosserver.somedomain.com’ AS nagiosserver, urn AS hostname, metric AS servicename, ‘CRITICAL’ AS alertlevel, ‘Alert comes from rack ‘ || ‘ source:’ || source AS alertmessage from LogTick(metric=’gpo:is_available’) where value = 0
- If a urn with the metric gpo:is_available is observed once, but not observed again for 60 min emit WARNING select ‘nagiosserver.somedomain.com’ AS nagiosserver, a.urn AS hostname, a.metric AS servicename, ‘WARNING’ AS alertlevel, ‘Alert comes from monitoring system ‘ || ‘ source:’ || a.source AS alertmessage from pattern [ every a=LogTick(metric=’is_responsive’) -> (timer:interval(60 min)) and not LogTick(urn=a.urn) ] group by a
In addition to Alert Queries there are Report Queries. Report Queries do not provide external alerting, but don’t require a specific output format. The output of a Report Query will be stored in a database, which is accessible from the Monitoring site.
The following queries are examples of Report Queries:
- Ping times greater than 10,000ms select * from LogTick(metric=’ping_rtt_ms’) where value > 10000.0
- If a urn is seen and then not seen again for 60min select count(*) from pattern [ every a=LogTick -> (timer:interval(60 min)) and not LogTick(urn=a.urn) ] group by a
Creating stream queries
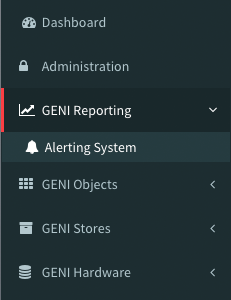
- Login to the GENI Monitoring site: [ http://genimon.uky.edu]
- Click on the Alerting System under the GENI Reporting tab, as shown in the figure below.
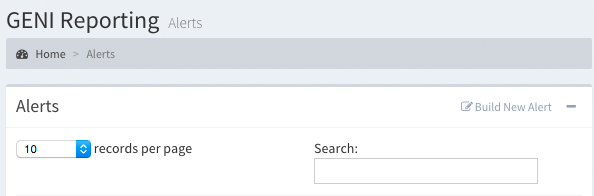
- On the Alert page click on Build New Alert on the top right of the screen, shown in the figure below.
- You are now in the stream query builder page, shown in the figure below.
-
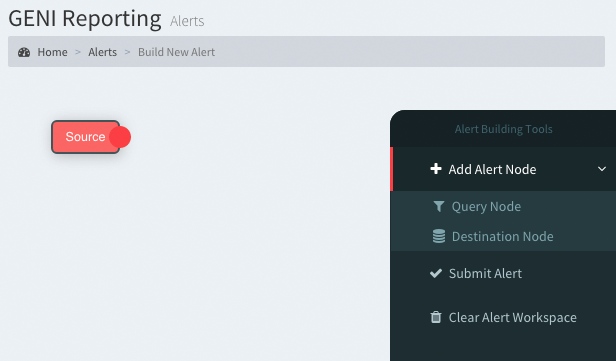
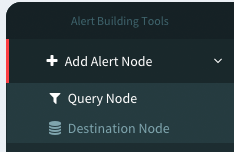
- On the stream query builder page, click on Query Node under Add Alert Node, shown in the figure below.
-
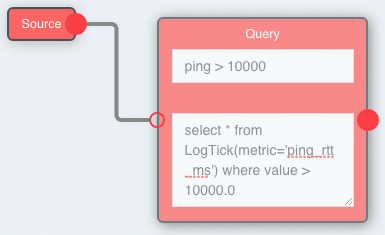
- In the query node fill in the Query Name and Query String fields. The query name field should describe your query and the query string should be a valid EPL query, which uses the LogTick class.
- Click on the left edge of your query node and connect your query node to the source node. The source node is the source of LogTick events, based on raw polling metrics. An example query is shown in the figure below.
-
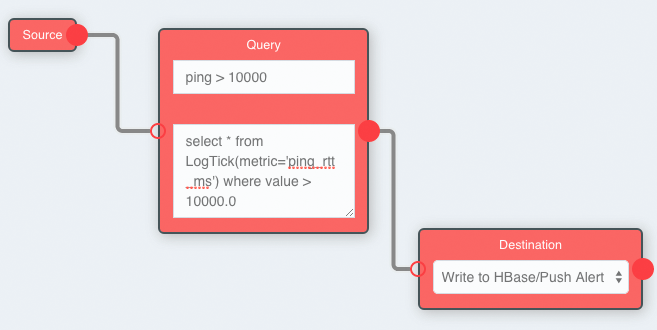
- You must now provide a destination for the query output. On the stream query builder page, click on Destination Node under Add Alert Node, shown in the figure below.
-
- Using the dropdown box on your destination node select your query destination, then connect your destination node to your query node, much how you connected your query node to your source node.
- Once a source, query and destination have been configured, as shown in the figure below, click on Submit Alert on the Alert Building Tools toolbar.
References
*Image from RabbitMQ tutorial https://www.rabbitmq.com/tutorials/tutorial-three-python.html
**Image from Esper http://www.espertech.com/